
Microfluidic devices have been established as versatile platforms to mimic various culture conditions or microenvironments in 2D and 3D tissue models. Oxygen availability in the cellular microenvironment strongly affects the cellular phenotype and metabolism. Therefore, monitoring oxygen tension inside microfluidic devices is essential, as it brings the in vitro conditions closer to real physoxia in cell culture and provides the basis for more reproducible and standardized results with maximal physiological relevance.
Many commonly used measurement techniques for oxygen monitoring are not applicable in such small volumes, consume oxygen during the measurement process, or directly affect the cells. The use of optical oxygen sensors, based on the principle of dynamic luminescence quenching, overcomes these drawbacks. These sensors are small, and the signals are recorded in the form of visible light, so that data acquisition from the outside through the transparent walls of microfluidic chips is easily accessible. In this study, we use a 2D sensor readout system, called VisiSens, along with planar optical oxygen sensor foils integrated in microfluidic channels to investigate oxygenation in microfluidic cell culture.
Materials and methods
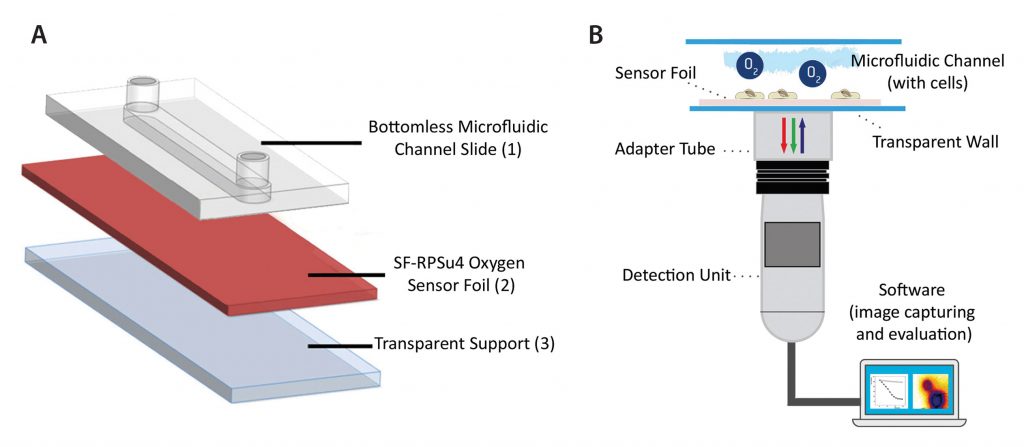
The oxygen-sensitive planar sensor foil type SF-RPSu4 (PreSens) was immobilized upon a microscope slide using a silicone adhesive. A self-adhesive microfluidic structure without bottom plate (sticky-Slide I, 0.4 luer, ibidi) was glued to the sensor foil providing the final microchannel with integrated planar oxygen sensor (Figure 1A). The self-adhesive structure had a height of 450 μm, a channel volume of 113 μL, and a growth area of 2.5 cm².
The planar sensor was read out using the VisiSens A1 oxygen imaging system (Figure 1B). The readout device was a USB-powered CMOS camera detector with incorporated excitation LEDs and optical filters. The sensor foil was excited using blue light, and it returned red and green fluorescence emission. The ratio of red and green signals provided an oxygen-dependent, ratiometric response in each pixel within the field of view.
Two-point calibration of the sensor was accomplished applying cell culture media with 0% (v/v) O2 (medium supplemented with 10 g/L Na2SO3) and 100% air saturation. Automated time-series recording and evaluation of the oxygen images was performed with the VisiSens Analytical 1 software.
MDCK II cells were grown to confluence in the final microfluidic chip under static conditions starting with a cell density of 1.0 × 10⁵ cells cm−2. The regular growth medium was replaced by serum-free L-15 medium at the beginning of the experiment. Two-dimensional oxygen recordings of the cell microenvironment under static conditions were started 24 hours after seeding, and readings were taken every 5 minutes. The medium was exchanged manually in regular intervals by flushing 1 mL fresh L-15 medium through the channel.
Results
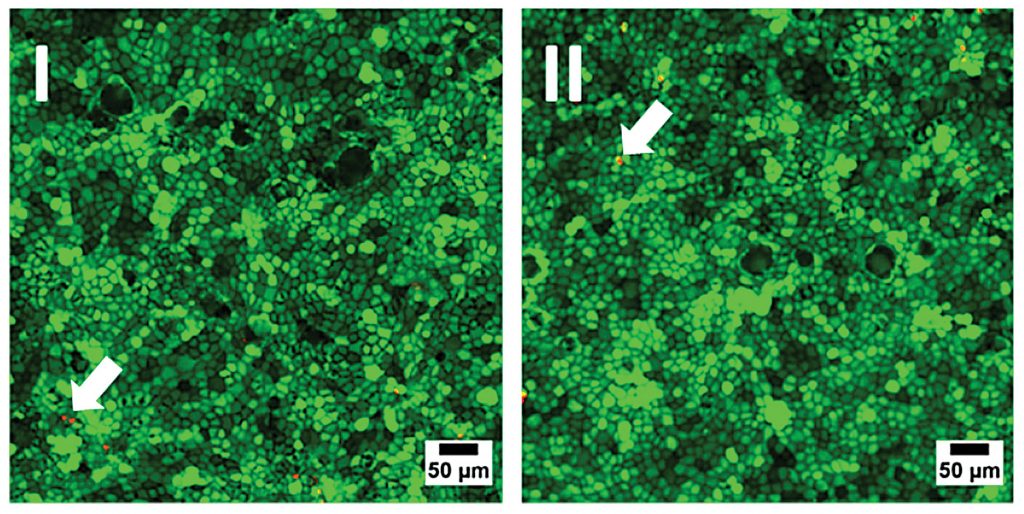
Initially, the biocompatibility of the sensor foils was investigated by seeding identical numbers of MDCK II cells into regular petri dishes made from cell culture–treated polystyrene and into petri dishes with an oxygen sensor foil glued to the bottom of the dish. Cells were grown to confluence, and cell viability was documented for the different substrates by an established live/dead staining technique (Figure 2). Both samples showed similar results with only very small amounts of red-emitting dead cells in the monolayer (arrows in Figure 2). Accordingly, the oxygen sensor foils have proven their biocompatibility and can be used as a substitute for regular cell culture plastics.
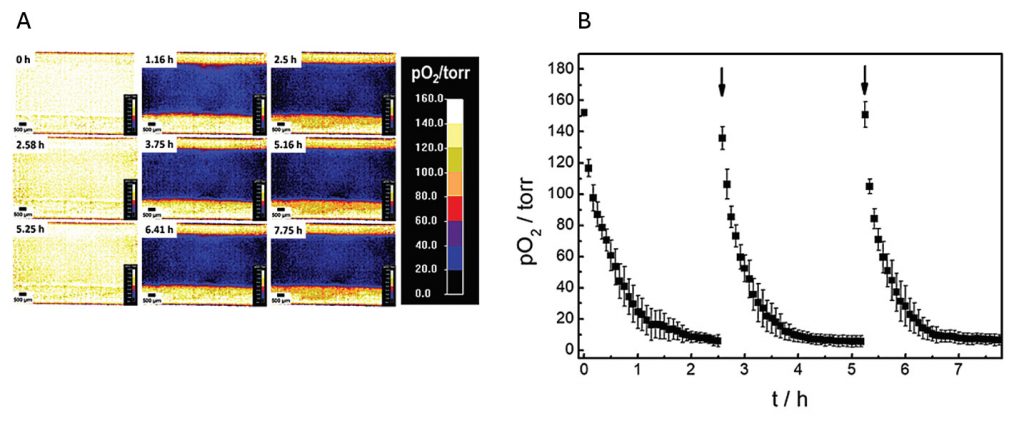
The oxygenation inside the microfluidic channel, and thus the microenvironment of the cells, was investigated in a time-series experiment with intermittent exchange of the assay buffer. Changes in spatial oxygen distribution over time were reported as false-color images (Figure 3A). The 2D “oxygen images” were recorded by adjusting the field of view to cover the whole channel width. The time series of images illustrates a laterally homogeneous, fast drop in oxygen levels within 1 h as a result of cellular respiration in a nonperfused system made from materials with low oxygen permeability. The intermittent exchange of cell culture medium at 0 h, 2.58 h, and 5.25 h led to a repeated, complete, and homogeneous channel reoxygenation.
Once a region of interest (ROI) is selected, the time-dependent changes in oxygen levels can be followed quantitatively as a function of time. Three consecutive oxygen consumption profiles of MDCK II cells cultivated with intermittent flow are shown in Figure 3B. Upon addition of fresh L-15 medium, pO2 increases to normoxic values of around 150 torr. As cells in the channel consume oxygen without any significant oxygen influx from outside, a fast 50% decrease of pO2 is observed within 0.3 ± 0.1 h after medium exchange. pO2 rapidly drops to hypoxic values below 10 torr within 1.5 ± 0.2 h. For these and similar closed fluidic devices, we determined that typical oxygen consumption rates are between 17 and 22 pmol/s for confluent MDCK-II cell layers from these kinds of oxygen images when planar sensor foils are used.
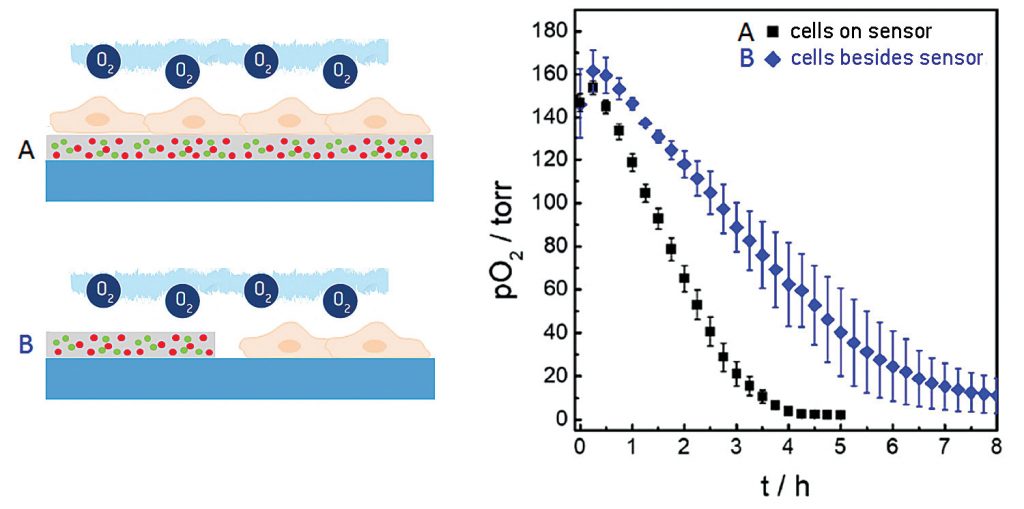
In the measurements described above, we used the planar oxygen sensor foils as sensor and growth substrate for the cells at the same time. Under these conditions, the distance between the lower cell membrane and sensor was on the order of 20–200 nm, depending on cell type. Due to the small distance between membrane and sensor surface to be bridged by diffusion, as well as the high oxygen permeability of the cell membrane, this architecture accounts for the sensor’s rather short response time and the unique lateral resolution that is obtained when oxygen gradients are imaged.
However, sensor foils can also be applied cell-free to probe the oxygenation of the microenvironment next to the cells. Figure 4 shows a comparison of the integrated sensor response when the cells under study are cultured directly upon the sensor surface (black curve), as in the examples described above, or next to it (blue curve). The time-dependent decrease of pO2 showed significant differences in these two experimental situations. The reason for the slower decline of pO2 when the cells were grown next to the sensor foil was the extra diffusional distance between the respiring cells and the sensor as well as the differences in the liquid volumes that are being probed in either setup.
Discussion and conclusion
Our study showed that oxygen can be measured directly inside microfluidic chips via the use of luminescent sensors integrated into the growth substrate. This label-free measurement technique enables a quantitative 2D readout with the option to analyze local oxygen concentrations and gradients in any field of view. The data in this study showed how quickly the cell microenvironment turns hypoxic under static culture conditions with large impact on viability and proliferation of the cells under study. Control of oxygen levels and well-adjusted perfusion is mandatory in those systems to get as close as possible to physoxic cell phenotypes and relevant readouts of cell-based assays.
Carina Schmittlein and Lisa Sauer are PhD students at the Institute of Analytical Chemistry, Chemo- and Biosensors, University of Regensburg. Robert Johannes Meier, PhD, is a researcher and Gregor Liebsch, PhD, is head of R&D imaging solutions at PreSens Precision Sensing. Joachim Wegener, PhD, is a professor at the Institute of Anaytical Chemistry, Chemo- and Biosensors, University of Regensburg and the Fraunhofer Research Institute for Microsystems and Solid State Technologies, Regensburg, Germany.

Comments are closed.